|
Bulletin of Applied Computing and Information Technology |
Refereed Article A2:Visual Interactive Artificial Neural Network (VIANN) tutor |
|
07:01 |
|||||||||||||||||||||||||||||||||||||||||||||||||||||||||||||||||||||||||||||||
Lakshmi Prayaga Chandra Prayaga Sharon Simmons El-Sheikh, E. Prayaga, L., Prayaga, C., Simmons, S., & El-Sheikh, E. (2009). Visual Interactive Artificial Neural Network (VIANN) tutor. Bulletin of Applied Computing and Information Technology, 7(1). Retrieved March 14, 2012 from http://www.naccq.ac.nz/bacit/0701/2009Lakshmi_VisualTutor.htm AbstractA Visual Interactive Artificial Neural Network (VIANN) Tutor has been designed in Visual Basic.net, which can be used as a teaching and self-learning tool for an introduction to neural networks. The tutor provides a simple graphical interface for the user to design a Hopfield type of network, and examine its evolution, starting from a prescribed initial state, and ending in a stable state or in a cycle of states mimicking a biological neural network in the brain. The user can change the network during runtime and observe changes in the evolution of the network. The interactive features allow the user to predict the evolution of the network and verify the prediction by running the model network. Initial evaluations of VIANN were conducted in an introductory Computer Science course (Excursions of Computing) open to all students and in an upper-level course in Artificial Intelligence. Responses of students to surveys administered after using the system showed that the tutorial was helpful to both beginner students, as well as those who were further along in the program. In addition, it was interesting to both computer science students as well as students majoring in other disciplines. Feedback from the students indicated that such tutorials would also be very helpful in the other sciences. Keywordsneural network tutorial, interactive learning environment, visualization tool, simulation, Computer Science education 1. IntroductionMany universities and colleges adopt the concept first approach (DuHadway, Clyde, Recker, and Cooley, 2002) to introduce students to Computer Science. Neural networks, artificial intelligence, distributed networks, machine-level programming, etc are some topics that are fundamental to computer science because of their theoretical underpinnings and broad variety of applications. For example, the Hopfield network or Perceptron models of neural networks "have already found wide application outside of neuroscience - in fields as diverse as signal processing, recognition and synthesis of speech, financial forecasting and modeling, and medical diagnosis" (Catterall, 1998). However, students in introductory computer science courses with multidisciplinary backgrounds find it difficult to comprehend abstract concepts. Students often find such topics demanding and require extra efforts to understand them well. Advances in technology provide tools that enable instructional designers to make such abstract concepts more concrete through visualizations. The purpose of this paper is to present the development of the Visual Interactive Artificial Neural Network (VIANN) Tutor for the Hopfield model and evaluate its usefulness as a learning tool. The purpose of the tutor is to assist students at various levels in understanding the working of a Hopfield-type ANN, and in following the evolution of the network toward either a stable state or a set of final states through which the network cycles, depending on the initial state. This simulation models the functioning of a biological neural network in the human brain, during the process of learning and remembering. Given a set of stimuli, the human memory is able to remember a certain event, or any other type of association and we may say "that these stable firing patterns of the network correspond to the desired memories we wish to store" (Caterall, 1998). The next section provides a review of the literature on the use of visualizations and simulations in course delivery. The article then describes the VIANN tutor, including the theoretical background, design, implementation, and usage of the system. Experimental tests were conducted in two undergraduate Computer Science courses to evaluate students' perceptions of the system, specifically in an introductory Computer Science overview course, and in an advanced course on Artificial Intelligence. The results of these surveys are presented in section 6. The article concludes with a discussion of the applications, benefits, and limitations of the system, as well as directions for future work. 2. Literature Review on Visualizations and Simulations in Course DeliveryA visualization tool holds potential to be much more effective than a textual description for understanding basic concepts as well as for complex topics. Woszczynski , Guthrie, Chen , Shade (2004) suggest that people can be categorized into one of the four categories: Sensory Thinker (ST), Sensory Feeler (SF), Intuitive Thinker (NT) and Intuitive Feeler (NF). People's learning styles and abilities differ greatly on the basis of their cognitive traits. However, an interesting observation made by Woszczynski et al. is that no matter what type of cognitive characteristic a student might have, visualization tools can provide the support required for learning. The process of visual learning involves the use of graphics, images, and animations to enable and enhance learning (McGrath and Brown, 2005). Advances in technology make it possible to generate visualizations that cater to every discipline, specifically in STEM. McGrath and Brown (2005) suggest the following benefits of visual learning:
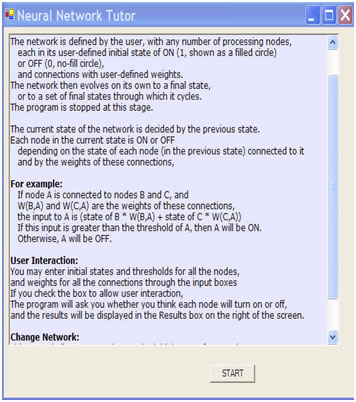
Naps, Rößling, Almstrum, Dann, Fleischer, Hundhausen, Korhonen, Malmi, McNally, Rodger, and Velázquez-Iturbide (2003) explored the role of visualization tools in Computer Science education. Their report emphasized the use of visualization tools to engage learners in active learning experiences, and presented a taxonomy of learner engagement and a framework for evaluating the effectiveness of such visualization tools. Additional evidence suggests that visualization plays a major role in understanding abstract concepts and, in fact, sometimes such concepts cannot be communicated without visualizations (McGrath and Brown, 2005). Moreover, thinking and communicating visually involve use of higher cognitive parts of the brain, contributing to higher levels of research from the individual (McCormick, DeFanti, and Brown, 1987). Urquiza-Fuentes and Velázquez-Iturbide (2009) concluded that educational visualizations can improve student engagement levels in general. Research also suggests that exploratory learning, during which the learner explores unfamiliar concepts and knowledge, is an effective way to learn (Kashihara, Oppermann, Rashev, and Simm, 2000; Carroll, Mack, Lewis, Girschkowsky, & Robertson. 1985). Exploratory learning essentially is self-directed and promotes constructive learning (Fone, 2001). Fone additionally suggests that an unstructured environment with unlimited choices in an exploratory world is often counter productive. Kashihara et al (2000) suggest that learning environments need to be limited in scope to reduce the cognitive overload placed on a student. This can be achieved by an environment that focuses on providing relevant information with limited choices. VIANN incorporates these principles in its design. Available resources of artificial neural networks (Brookshear, 2004; Jain, Jianchang, and Mohiuddin, 1996; Moore, 2006; Fone, 2001) are mostly text-based, very exhaustive and overwhelming or do not provide for flexibility and run-time interactivity. They are not accessible to beginner students either due to high cost or complexity of both the environment, and type of problems tackled. VIANN is an interactive simulation of an artificial neural network. VIANN engages students in the actual run-time environment because it prompts users to predict the next state of a neuron thus checking comprehension. VIANN walks students through the evolution of the network as it reaches a stable state. Simulations have also been cited as effective instructional strategies especially in teaching science concepts. Lee, Hairston, Thames, Lawrence, and Herron (2002) presented their work in teaching an introductory biology lab course with Lateblight software and argue that interactive simulations help students understand the scientific process which is to "engage, explore, explain, elaborate and evaluate". Chance and Rossman (2006) suggest that simulations are very effective in teaching abstract concepts in Statistics, for example, the concept of repeated random processes. (Squire, Barnett, Grant and Higginbotham, 2004; Lee, Nicoll, and Brooks, 2004) argue that projects such as Electromagnetism supercharged and Physlets demonstrate that interactive simulations can be helpful in teaching theoretical concepts in Physics. Researchers from the Colarado University working on the PHET project state that "simulations make the invisible visible (e.g. electrons, photons, field vectors), and include the mental, visual models that experts use to aid their thinking - design features which help students build their own understanding and skills". Interactive simulations are also helpful since they can be self-paced, student controlled, repeated, and provide instant feedback (Cotton, 1991; Wieman, Adams, Perkins 2009). Bayrack (2008) reports that use of simulations in teaching the concept of Geometric Optic in a second course in Physics resulted in an improvement in the treatment group's post-test score for that topic vs. the scores for students in the control group who had traditional face-to-face instruction. An additional theoretical backing for interactive simulations is that they are grounded in constructivist learning, which researchers point out is an effective form of learning (Lee, Hairston, Thames, Lawrence, and Herron, 2002). Students retain knowledge longer when they experiment with the content to be learned since they internalize the concepts. VIANN has been designed with these supporting theories of the effectiveness of simulations in simplifying the comprehension of abstract concepts. VIANN helps students understand the process of how the neural networks in the brain work, through an interactive simulation in the form of an artificial neural network . 3. VIANN - Design and MethodologyVIANN is based on the idea of an Artificial Neural Network (ANN), which is "constructed from many individual processors, which we will call processing units (or just units for short); in a manner that models networks of neurons in living biological systems" (Brookshear, p. 423, 2004). Cognitive theories discuss several types of information processing mechanisms including stage models of information processing, parallel-distributed processing and connectionist processing models (Huitt, 2003). These theories explain how the brain processes information and learns. An ANN is designed to emulate this learning process. One approach to design an ANN is to model it to be an adaptive learner, i.e. it can be programmed to behave with a deterministic outcome based on the input it receives. Another approach is to model a neural network which is a closed ring, in some cases called Hopfield's network (Brookshear, 2004). In Hopfield networks, "the outputs of each processing unit is connected as inputs to each of the other units, and in other cases the output of a unit may be connected only to its immediate neighbor" (Brookshear). These networks, under certain conditions, are able to mimic associative memory. Depending on the weights of the connections and the initial state of the entire network, the network evolves to either a final stable state or it cycles through a set of states. VIANN presented in this paper is designed to mimic such networks. The design features of VIANN have been grounded in theory, incorporate interactivity, structure, and offer limited choices to avoid cognitive overload suggested by Kashihara, Oppermann, Rashev, and Simm (2000). Pagliano, Brown, Rule, and Bajzek, (2007) suggest that "tutorials with tightly coupled animations and assessments provide more contextual richness to the students". In keeping with this suggestion, a novel feature of VIANN is the addition of user interactivity to the simulation (animation) that provides assessment on student's VIANN allows students to construct example cases of "what-if" analysis and observe the results. Such interactive experiential activities help students explore the behavior of a neural network, and as a result, understand the concepts more effectively. VIANN is structured in that it guides and prompts the student to follow an orderly procedure (add a node, set its weight, set the threshold) in designing the network. The student also only has a limited number of choices available when working with VIANN at any given time. For example, after setting the parameters for the network (number of nodes, weights, and threshold) the student is required to focus on understanding the current state of the network and predict the next state. Such a controlled interaction helps the student focus on the critical aspects of the simulation, without distraction of extraneous inputs. VIANN similarly, includes the aspects of exploration suggested by Fone (2001), thus allowing the student to learn from doing or constructing something, in this case the network. VIANN is a graphical environment designed in Visual Basic.net (VB) for an ANN of the Hopfield type. In this environment, an ANN consists of a number of Processing Nodes representing neurons. The nodes are connected to each other forming a network. Each node is characterized by a State (ON - 1, or OFF - 0) and a Threshold (decimal number). Each pair of nodes is linked by a Connection which has a Weight (decimal number) associated with it. The user designs the network by entering the initial state and threshold of each node, for as many nodes as desired, and also the weights of all the connections. A weight of zero implies no connection; a positive weight implies an excitatory connection and a negative weight, an inhibitory connection. All these values are entered through Input Boxes, with default values provided for guidance. Two data grids, one for the nodes and one for the connections, get populated with the user-entered values for purposes of display and desired changes of the network. The system then displays the network in its current state in a display form, and takes the network through all possible states, displaying each state in turn. VIANN is designed with facilities to provide flexibility and interactivity to the user with the following features: ScalableVIANN is scalable in that there are no preset limits on the number of nodes that can be supported by the network. The user has the flexibility to enter as many nodes as desired. User Inputs / Parameters (states, thresholds, and weights)The user is allowed to enter all the required parameters for the network to function. These parameters include the state and threshold of each node, and the weights for all the connections between the nodes. Default values of these parameters are displayed during parameter-value entry for guidance. Provides for any type of network (all connected or a ring network are default)VIANN allows the user to specify the type of network by allowing entry of arbitrary values for the parameters. The default choices available are a ring network or an all-connected network. The weights of the connections may be changed by the user to produce any desired configuration of the network. User Interactivity (predict the next state)VIANN provides the user with a choice to either predict the next state and check it against the network's calculations or let the system show the different states leading to the final state. Change parameter values for weights and states and observe resultsA final feature of VIANN is that it allows the user to change the weights for the connections and the states of the nodes and observe the resulting change in the behavior of the network. An important point to note here is that it is possible for the user to change the weights during runtime, immediately run the network again, and study the change in behavior. It is not necessary for the user to exit out of the runtime environment to view the results of the changes. Such a feature avoids the need to re-enter all the values, which can become tedious and interfere with the learning process. 4. VIANN - UsageThis section describes the use of the system. The VIANN user interface has three different forms, start form, design form, and display form which are described below. Start form - "Neural Network Tutor": This form briefly describes the interface and provides instructions to the user to supply the required data. The "START" button on this form takes the user to the "Neural Network Design" form, as shown in figure 1. Design form - "Neural Network Design": On this form, the "Add Processing Node" button allows each node to be added by entering the State and Threshold values via input boxes. The Threshold values are by default set to 1.0 for all the nodes. The user may enter any desired value. Once all the desired nodes are created, the values are seen in the data grid "Processing Nodes". Any of the values can be changed by the user if so desired. Next, the connections have to be specified. The default configuration of the network is the all-connected configuration, with a weight of 1.0 for all the connections. The user may choose a "Ring Configuration" by checking the box provided for that purpose, in which case, each node is connected to the next with a default weight of 1.0, and all other weights are set to zero. The last node is connected to the first, also with a default weight of 1.0, completing the ring. In either the all-connected or Ring Configuration, the user can change any of the weights. The weights of all the connections are displayed in a second data grid, "Connections". As in the case of the "Processing Nodes" data grid, any of the weights of the connections may be changed by the user. Figure 2 presents the form to collect user input for the neural network.
Figure 1. Start Form
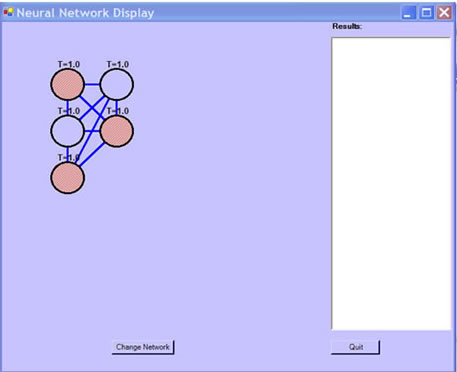
Figure 2. Design Form (User Input) Display form - "Neural Network Display": Once the user has specified the design of the network, the button "Show Initial State" in the Design form shows the "Neural Network Display" form. This form displays a visual graphics depiction of the network with all the nodes and connections, with ON nodes shown as filled circles, and OFF nodes as empty circles. At this stage, the user may allow the network to evolve on its own by pressing the "Show Finished State" button, or check the "Allow User Interaction" checkbox, and then press the "Show Finished State" button. In the former case, the network evolves towards a final state, each intermediate shown in the Display form. The "Results" text box in the display form prints a history of the network evolution including all the intermediate states and the final state. The final state is reached when the current state is a repeat of any of the previous states of the network, and the processing stops. In the latter case, VIANN prompts the user to predict the state of each Processing Node in the next state of the network, compares the prediction with the calculated state, and provides feedback. 5. VIANN - ImplementationIn the program, the nodes are instances of the cNode class, with properties Index, State and Threshold. The cNodes() array is an array of nodes, so cNodes (0) refers to the node with index 0. The connections between nodes are instances of the cConnection class, with a property called weight. The Connections ( ) array is a two-dimensional array of connections. Each element of the array refers to the connection between two nodes. For example, Connections(2, 3).weight is the weight of the connection from node with index 2 to node with index 3. Three state arrays are used in the program to keep track of the evolution of the network, initState(), prevState(), and currState(). These are arrays of 1s and 0s. For example, a 5-node network might start from an initial state given by the initState() array 10101. The history() array is an array of state arrays, and keeps track of the states Calculating the evolution: The button "Show Initial State" populates the initState array, and visually shows the network in the initial state. The button "Show Final State" takes the network through its evolution with the following steps:
Let Ini be the input to node i in the network, Ti the threshold of node I, Sj the state of node j (in the Previous State), and wji the weight of the connection from j to i. Then the input to node i is given by
where the summation is over all nodes j other than i. Note that if a node j is not connected to node i, the corresponding weight wji = 0. The state of node i in the Current State of the network is determined by the following condition:
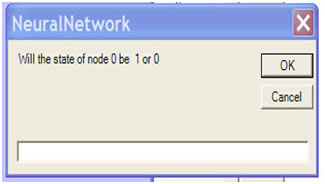
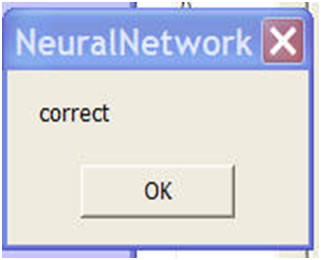
If the "Allow User Interactivity" button is not checked, then the "Show Final State" button displays in succession all the states in the evolution of the network determined by the logic discussed above and the entire history of the evolution is printed in the "Results" box for the user. Figures 3, 4, 5 and 6 show the display forms and the interactive aspects of VIANN. Figure 3 is a display of an all connected five node state, Figure 4 is a display of interactivity provided by the software to get user input, Figure 5 is a display of feedback provided by the software for the user input, and Figure 6 is the display of the final stable state of the network.
Figure 3. Display of all connected network (Initial State)
Figure 4. Prompt to the user
Figure 5. Feedback from the program
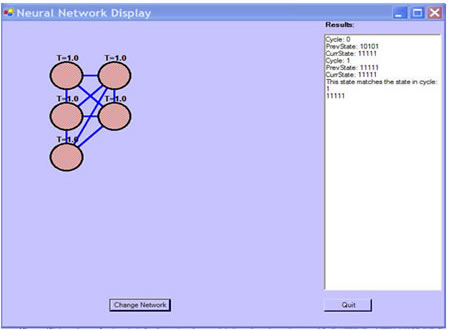
Figure 6. Final state of neural network with history of the net work Relations (1) and (2) above can be used to predict the evolution of the network. As an example, tables 1 and 2 provide a hand trace for a Ring network and an all-connected network with 5 nodes and initial states as shown in row 1. For this trace, the default values for weights (1.0) and threshold (1.0) were used. In table 1, node 0 has initial state 1 and threshold value 1.0; node 1 has initial state 0, threshold 1.0 and so on. The initial state of the network is thus specified by the array initState() with array elements 10101. Result of the network after processing each complete cycle is presented in table 1. At runtime, if the user selects "Allow User Interaction", the user is prompted to predict the next state of the network, node by node. When "Show Final State" button is pressed, the user is presented with an input box, prompting the user to predict the state of the network, cycle by cycle, node by node. The program assigns the initState() to the prevState() array, and then uses relations (1) and (2) to calculate the currState() array. For example, the current state of node 0 is calculated from the inputs from all other nodes. In a Ring, the weights of Connections(1, 0) and Connections(4, 0) are equal to 1.0, whereas all other Connections leading to node 0, such as Connections(3, 0), have weight 0, since node 3 is not connected to node 0 in the Ring configuration. So the relation (1) becomes: State of Node 1 * weight of the connection from node 1 to node 0 = (0 * 1.0) = 0 +State of Node 4 * weight of the connection from node 4 to node 0 = (1 * 1.0) = 1 Total = 0 + 1 = 1 If the sum of these two values is greater than the threshold value, then the state of the node changes to 1, else it is set to 0. In this case since the Total is 1, it is not greater than the threshold value 1, the state of the node is set to 0. This process is repeated for all the nodes. Once all the nodes have been processed, the current cycle is completed and the network is set to these calculated states and the next cycle starts. The processing stops when the network either reaches a stable state mimicking associative memory or cycles through a set of states. In table 1, the network reaches a stable state when the states of nodes in cycle 4 match the states of nodes in cycle 3. Weight = 1.0 if two nodes are connected, 0 otherwise; Threshold = 1.0 for all nodes. The state after cycle 3 is identical to the state after the previous cycle, and the processing stops. Experimenting by providing VIANN with values given in the initial state for the five nodes with a ring network will produce results identical to those in table 1. Table 1. Trace for a Ring network with 5 nodes
Calculations for Cycle 0 in table 1 with user entered values from initial state: state of node 0 = state of node 1 * weight of connection(1, 0) + state of node 4 * weight of connection(4, 0) = 0 * 1 + 1 * 1 = 1, not > threshold value of 1, so state of node 0 = 0 state of node 1 = state of node 0 * weight of connection(0, 1) + state of node 2 * weight of connection(2, 1) = 1 * 1 + 1 * 1 = 2, is > threshold value of 1, so state of node 1 = 1 state of node 2 = state of node 1 * weight of connection(1, 2) + state of node 3 * weight of connection(3, 2) = 0 * 1 + 1 * 1 = 1, not > threshold value of 2, so state of node 2 = 0 state of node 3 = state of node 2 * weight of connection(2, 3) + state of node 4 * weight of connection(4, 3) = 1 * 1 + 1 * 1 = 2, > threshold value of 1, so state of node 3 = 1 state of node 4 = state of node 3 * weight of connection(3, 4) + state of node 0 * weight of connection(0, 4) = 0 * 1 + 1 * 1 = 1, not > threshold value of 1, so state of node 4 = 0 Values for Cycle 1 are derived by calculations from values in cycle 0, and values for Cycle 2 are calculated from values in Cycle 2 etc. In table 2, (five nodes, all connected) the network reaches a stable state in Cycle 1 when the state in cycle 1 matches that after Cycle 0. Table 2. Trace for an all connected network with 5 nodes, Weight = 1, Threshold = 1
6. Experimental Methodology and EvaluationTo evaluate its effectiveness, this tutorial was tested in two courses during the Fall of 2008. One of the courses was an introductory Computer Science course (Excursions of Computing) open to all students and the second was an upper-level course in Artificial Intelligence. The total number of students was 24. Research Objective and QuestionsThe main goal of the experimental test was to evaluate students' perceptions of the usefulness of VIANN Tutor. Surveys were developed that included five questions that asked the students to evaluate the tool along several dimensions, including its user interface, presentation of content, benefit towards learning, and other areas of application. The results of students' perceptions of the system from the surveys were analyzed and summarized. ProcedureThe researchers demonstrated the tutorial in each of these classes and administered a survey to the students at the end of the presentation. After that, students were allowed to use the software freely to experiment with it. Data CollectionAfter the students experimented with the software, they were given a survey to be completed. The survey was designed to collect information on (1) student knowledge about neural networks, especially was there a difference between freshman coming into computer science and those who were taking a course on Artificial Intelligence as an upper division course, (2) feedback on the user interface, (3) clarity of the tutorial, (4) student benefit from the tutorial and (5) feedback on other areas where students felt that simulations would help. Experimental ResultsThe results of the surveys administered to the students are given in table 3. Table 3. Results from the survey
From this pilot study, the following conclusions can be made:
7. Conclusions and Future WorkThe VIANN tutorial was designed as introductory educational tool for Hopfield neural networks. In addition to providing a visual learning environment, VIANN provides flexibility and interaction with the learners. Flexibility is achieved by allowing scalability of the network, a configurable network layout, and tunable parameters for the network. The interaction is forefront in the design and evolution of the network. When entering network parameters, the users are guided with suggestions and default values. During execution, the user can predict states to reinforce the behavior of Hopfield networks. Additionally during execution, the user can modify parameters to experiment with effects on the network. The evaluation of this tutorial system was conducted with two diverse student populations: students new to the Computer Science program and advanced Computer Science students enrolled in an Artificial Intelligence course. The students, after using the software, completed a survey. Prior to running VIANN, 20 of the participating 24 students had no knowledge of neural networks. As indicated in the survey, students gained an understanding of the neural networks and could anticipate other subject matter where a visual interactive environment would be beneficial. This work provides reinforcement that visual interactive environments are a helpful learning aid for understanding complex material. Additionally, the results demonstrated that the tutor was useful for both beginner students and senior-level Computer Science students. This work motivates the development of additional interactive visual tutors. Future work directions include the development of tutors in the computer science areas of operating system process scheduling and network protocol stack interaction. ReferencesBayark., C., (2008). Effects of Computer Simulations Programs on University Students' Achievements in Physics, Turkish Online Journal of Distance Education-TOJDE October 2008 ISSN 1302-6488 Volume: 9 Number: 4 Article 3, retrieved on April, 20th, from: http://tojde.anadolu.edu.tr/tojde32/articles/article_3.htm. Brookshear, J., G., (2004). Computer Science An Overview, Eighth Edition, Pearson, Addison Wesley, USA. Carroll, J., Mack, R., Lewis, C., Girschkowsky, N., & Robertson, S. (1985). Exploring, exploring a word processor. Journal of Human-Computer Interaction. 1, pp. 283-307 . Catterall., S. (1998). Mind and Machine, Neural Networks. Retrieved on July 20th, 2008 from: http://physics.syr.edu/courses/modules/MM/n_net/what.html. Chance and Rossman (2006). Using Simulation to Teach and Learn Statistics, ICOTS-7, retrieved on April 20th, 2009 from: http://www.ime.usp.br/~abe/ICOTS7/Proceedings/PDFs/InvitedPapers/7E1_CHAN.pdf. Cotton, K. (1991). Computer-Assisted Instruction. School Improvement Research Series. Retrieved January, 1 2008, http://www.nwrel.org/scpd/sirs/5/cu10.html. DuHadway, L. P., Clyde, S. W., Recker, M. M., and Cooley, D. H. (2002). A concept-first approach for an introductory computer science course. J. Comput. Small Coll. 18, 2 (Dec. 2002), 6-16. Fone, W. (2001). Using a familiar package to demonstrate a difficult concept: using an excel spreadsheet model to explain the concepts of neural networks to undergraduates. In Proceedings of the 6th Annual Conference on innovation and Technology in Computer Science Education (Canterbury, United Kingdom). ITiCSE '01. ACM, New York, NY, 165-168. http://doi.acm.org/10.1145/377435.377675. Han, Z., Vondriska, T. M., Yang, L., Robb, Weiss, J. N., and Qu, Z. (2007). Signal transduction network motifs and biological memory. Journal of Theoretical Biology, 246(4):755-761, http://appliedcognitivescience.org/Memory%20A.html. Herman, A. and Michael, O., (2000). Artificial Neuron, retrieved on July 20th, 2008 from: http://lcn.epfl.ch/tutorial/english/aneuron/html/index.html. Huitt, W. (2003). The information processing approach to cognition. Educational Psychology Interactive. Valdosta, GA: Valdosta State University. Retrieved [date] from, http://chiron.valdosta.edu/whuitt/col/cogsys/infoproc.html. Jain, A. K., Jianchang M., and Mohiuddin, K. M., (1996). "Artificial neural networks: a tutorial," Computer , vol.29, no.3, pp.31-44, March 1996. J. J. Hopfield, (1982). "Neural networks and physical systems with emergent collective computational abilities", Proceedings of the National Academy of Sciences of the USA, vol. 79 no. 8 pp. 2554-2558, April 1982. Full article: http://www.pnas.org/content/79/8/2554.abstract. Kashihara, A., Oppermann, R., Rashev, R., and Simm, H., (2000). A cognitive load reduction approach to exploratory learning and its application to an interactive simulation-based learning system, Journal of Educational Multimedia and Hypermedia, v.9 n.3, p.253-276, Oct. 2000. Lee, K., Nicoll, G., and Brooks, D. (2004). A Comparison of Inquiry and Worked Example Web- Based Instruction Using Physlets. Journal of Science Education & Technology, vol. 13, no. 1, pp. 81-88. Lee, A. T., Hairston, R. V., Thames R., Lawrence, T. and Herron S. S. (2002). Using a Computer Simulation to Teach Science Process Skills to College Biology and Elementary Education Majors. Bioscene: Journal of College Biology Teaching. 28, 4, 35-42. McCormick, B. H., DeFanti, T. A., and Brown, M. D. (1987). "Visualization in Scientific Computing," Computer Graphics, vol. 21, no. 6, 1987. McGrath, B. M. and Brown, R. J., (2005). "Visual Learning for Science and Engineering," IEEE Computer Graphics and Applications , vol. 25, no. 5, pp. 56-63, September/October, 2005. Moore, A., (2006). Statistical Data Mining Tutorials, retrieved on July 20th, 2008 from: http://www.autonlab.org/tutorials/index.html Naps, T. L., Rößling, G., Almstrum, V. L., Dann, W., Fleischer, F., Hundhausen, C. D., Korhonen, A., Malmi, L., McNally, M. F., Rodger, S. H., and Velázquez-Iturbide, J. Á. (2003). "Exploring the Role of Visualization and Engagement in Computer Science Education," Proc. Conf. Integrating Technology into Computer Science Education (ITiCSE), SIGCSE Bulletin, vol. 35, no. 2, pp. 131-152, ACM Press, 2003. Pagliano, O., Brown, W., Rule, G., and Bajzek, D. (2007). Improving Animation Tutorial by Integrating Simluation, Assessment, and Feedback to Promote Active Learning. In T. Bastiaens & S. Carliner (Eds.), Proceeding of World Conference on E-Learning in Corporate, Government, Healthcare, and Higher Education 2007, pp. 144-150. PHET, (2008), retrieved on May 1st, 2009 from http://PHET.colarado.edu Squire, K., Barnett, M., Grant, J. M., and Higginbotham, T. (2004). Electromagnetism supercharged!: learning physics with digital simulation games. In Proceedings of the 6th international Conference on Learning Sciences (Santa Monica, California, June 22 - 26, 2004). International Conference on Learning Sciences. International Society of the Learning Sciences, 513-520. Urquiza-Fuentes, J. and Velázquez-Iturbide, J. Á. (2009). Pedagogical Effectiveness of Engagement Levels -- A Survey of Successful Experiences. Electron. Notes Theor. Comput. Sci. 224 (Jan. 2009), 169-178. DOI= http://dx.doi.org/101016/j.entcs.2008.12.061. Wieman, E., C.; Adams, K., W; Perkins K., K (2009), PhET Simulations that Enhance Learning, ScienceMag.org, retrieved on May 1st, 2009 from: http://phet.colorado.edu/phet-dist/publications/PhET_Simulations_That_Enhance_Learning.pdf Woszczynski, A, B., Guthrie, C, T., Chen, L, T., Shade, S., (2004). Personality as a Predictor of Student Success in Programming Principles I, 7th Annual Southern Association for Information Systems (SAIS), Savannah, GA, February 27-28. DownloadYou can download a zip file containing the software from http://www.uwf.edu/lprayaga/NNInteractiveLearning.zip About the authorsThe authors are from the University of West Florida, U.S.A.
Home | Issue Index | About BACIT
| |||||||||||||||||||||||||||||||||||||||||||||||||||||||||||||||||||||||||||||||||